准备
Table of Contents
开发环境设置
Google Cloud platform
预备知识
Python
def quicksort(arr):
    if len(arr) < 1:
        return arr
    pivot = arr[len(arr) // 2]
    left = [x for x in arr if x < pivot]
    middle = [x for x in arr if x = pivot]
    right = [x for x in arr if x > pivot]
    return quicksort(left) + middle + quicksort(right)

print(quicksort([2, 4, 10, 1, 2, 5]))
Numpy
Numpy 主要用于科学计算。它的主要功能是处理数组。
- arrays
a = np.zeros((2,2)) # Create an array of all zeros print(a) # Prints "[[ 0. 0.] # [ 0. 0.]]" b = np.ones((1,2)) # Create an array of all ones print(b) # Prints "[[ 1. 1.]]" c = np.full((2,2), 7) # Create a constant array print(c) # Prints "[[ 7. 7.] # [ 7. 7.]]" d = np.eye(2) # Create a 2x2 identity matrix print(d) # Prints "[[ 1. 0.] # [ 0. 1.]]" e = np.random.random((2,2)) # Create an array filled with random values print(e) # - Array indexing
a = np.array([[1,2,3,4], [5,6,7,8], [9,10,11,12]]) # [2,3][6, 7] b = a[:2, 1:3] - datatypes
x = np.array([1, 2]) print(x.dtype) #prints "int 64" - array math
x = np.array([[1, 2], [3, 4]])
print(np.sum(x))
print(np.sum(x, axis=0)) # print echo column sum
print(np.sum(x, axis=1)) # print echo row sum
a = np.array([[1, 2, 3], [3, 4, 5]]) b = np.array([1, 2, 3]) print(a - b)结果:
array([[0, 0, 0], [2, 2, 2]]) - broadcasting
- Doc
see here:
Scipy
Scipy build on the numpy.
- Image operations
Scipy 提供了很多的方法去处理图像。
from scipy.misc import imread, imsave, imresize # Read an JPEG image into a numpy array img = imread('assets/cat.jpg') print(img.dtype, img.shape) # Prints "uint8 (400, 248, 3)" # We can tint the image by scaling each of the color channels # by a different scalar constant. The image has shape (400, 248, 3); # we multiply it by the array [1, 0.95, 0.9] of shape (3,); # numpy broadcasting means that this leaves the red channel unchanged, # and multiplies the green and blue channels by 0.95 and 0.9 # respectively. img_tinted = img * [1, 0.95, 0.9] # Resize the tinted image to be 300 by 300 pixels. img_tinted = imresize(img_tinted, (300, 300)) # Write the tinted image back to disk imsave('assets/cat_tinted.jpg', img_tinted) - Distance between points
Scipy 提供了一些有用的函数去处理点之间的距离。 例如下面计算欧几里得距离。
Import numpy as np
from scipy.spatial.distance import pdist, squareform

# Create the following array where each row is a point in 2D space:
# [[0 1]
#  [1 0]
#  [2 0]]
x = np.array([[0, 1], [1, 0], [2, 0]])
print(x)

# Compute the Euclidean distance between all rows of x.
# d[i, j] is the Euclidean distance between x[i, :] and x[j, :],
# and d is the following array:
# [[ 0.          1.41421356  2.23606798]
#  [ 1.41421356  0.          1.        ]
#  [ 2.23606798  1.          0.        ]]
d = squareform(pdist(x, 'euclidean'))
print(d)
Matplotlib
- Plotting
import numpy as np
import matplotlib.pyplot as plt
x = np.arange(0, 3*np.pi, 0.1)
y = np.sin(x)
plt.plot(x, y)
plt.show()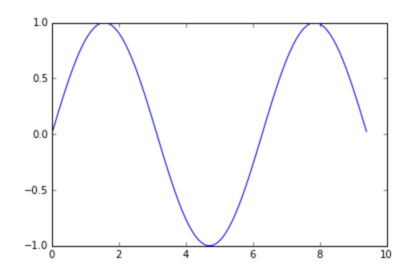
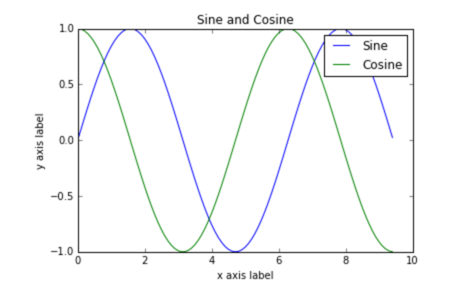
import numpy as np
import matplotlib.pyplot as plt

# Compute the x and y coordinates for points on sine and cosine curves
x = np.arange(0, 3 * np.pi, 0.1)
y_sin = np.sin(x)
y_cos = np.cos(x)

# Plot the points using matplotlib
plt.plot(x, y_sin)
plt.plot(x, y_cos)
plt.xlabel('x axis label')
plt.ylabel('y axis label')
plt.title('Sine and Cosine')
plt.legend(['Sine', 'Cosine'])
plt.show()
结果如下图。
- subplots
这个可以将多个要画的东西放到一个 figure 中来。 subplot(a, b, c) 表示创建 a 行,b 列的图,做为第 c 个图。
- images
we can use the imshow function to show images.
import numpy as np
from scipy.misc import imread, imresize
import matplotlib.pyplot as plt

img = imread('assets/cat.jpg')
img_tinted = img * [1, 0.95, 0.9]

# Show the original image
plt.subplot(1, 2, 1)
plt.imshow(img)

# Show the tinted image
plt.subplot(1, 2, 2)

# A slight gotcha with imshow is that it might give strange results
# if presented with data that is not uint8. To work around this, we
# explicitly cast the image to uint8 before displaying it.
plt.imshow(np.uint8(img_tinted))
plt.show()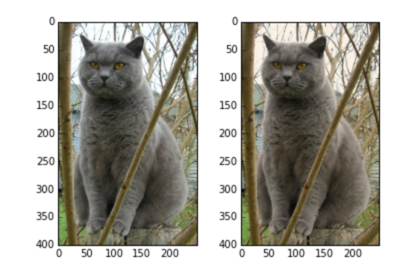
IPython Tutorial
具体代码中用到的函数
numpy 中 flatnonzero()
这个函数返回一个矩阵中非零元素的位置。 例如
x = np.arange(-2, 3)
        # x = array([-2, -1,  0,  1,  2])
        np.flatnozero(x)
        # array([0, 1, 3, 4])
如果是
d = np.array([1,2,3,4,4,3,5,3,6])
haa = np.flatnonzero(d == 3)
print haa
则是返回 d 中为 3 的元素的位置。
reshape
这个函数用于改变数组的结构。比如,3 维变 2 维。
reshape(a, newshape, order='C') 其中的 newshape 是 int 或 tuple。 例如下面的用法。
a = np.arange(6).reshape((3, 2))
array([[0, 1],
       [2, 3],
       [4, 5]])
# reshape 后要与原来的数据一致,当使用-1 的时候,numpy 会帮我们自动计算。 np.reshape(a, (3,-1)) array([[1, 2], [3, 4], [5, 6]])np.argsort
这个函数返回排序序号。 例如
x = np.array([3, 1, 2])
np.argsort(x)
array([1, 2, 0])
np.hstack
>>> x = np.array([[1, 2, 3], [2, 3, 5]])
>>> x
array([[1, 2, 3],
       [2, 3, 5]])

>>> np.hstack([x, np.ones((x.shape[0], 1))])
array([[ 1.,  2.,  3.,  1.],
       [ 2.,  3.,  5.,  1.]])
资源资料
数据集
这里我们会使用一个数据集,CIFAR-10。 这个数据集包含 6 万张图片,都是 32*32 像素组成。
这个数据集包括 50000 张训练数据,以及 10000 张测试数据。 他们的表示是四维的 array,即 50000*32*32*3。其中 3 表示每个 pixel 中 RGB 的值。
关于这部分数据是通过 pickle 处理过的数据。 我们可以通过下面的方式得到原始的字典结构。
import pickle
def unpickle(file):
        with open(file, 'rb') as fo:
                dict = pickle.load(fo, encoding='bytes')
        return dict
其中的 labelnames 在 batches.meta 中定义了。
    {
            'num_cases_per_batch': 10000,
            'label_names': ['airplane', 'automobile', 'bird', 'cat', 'deer', 'dog', 'frog', 'horse', 'ship', 'truck'],
            'num_vis': 3072
}